Semantic Content Mapping — Cannibalisation & content gaps
From fog to clarity: mapping the meaning of hundreds of articles.
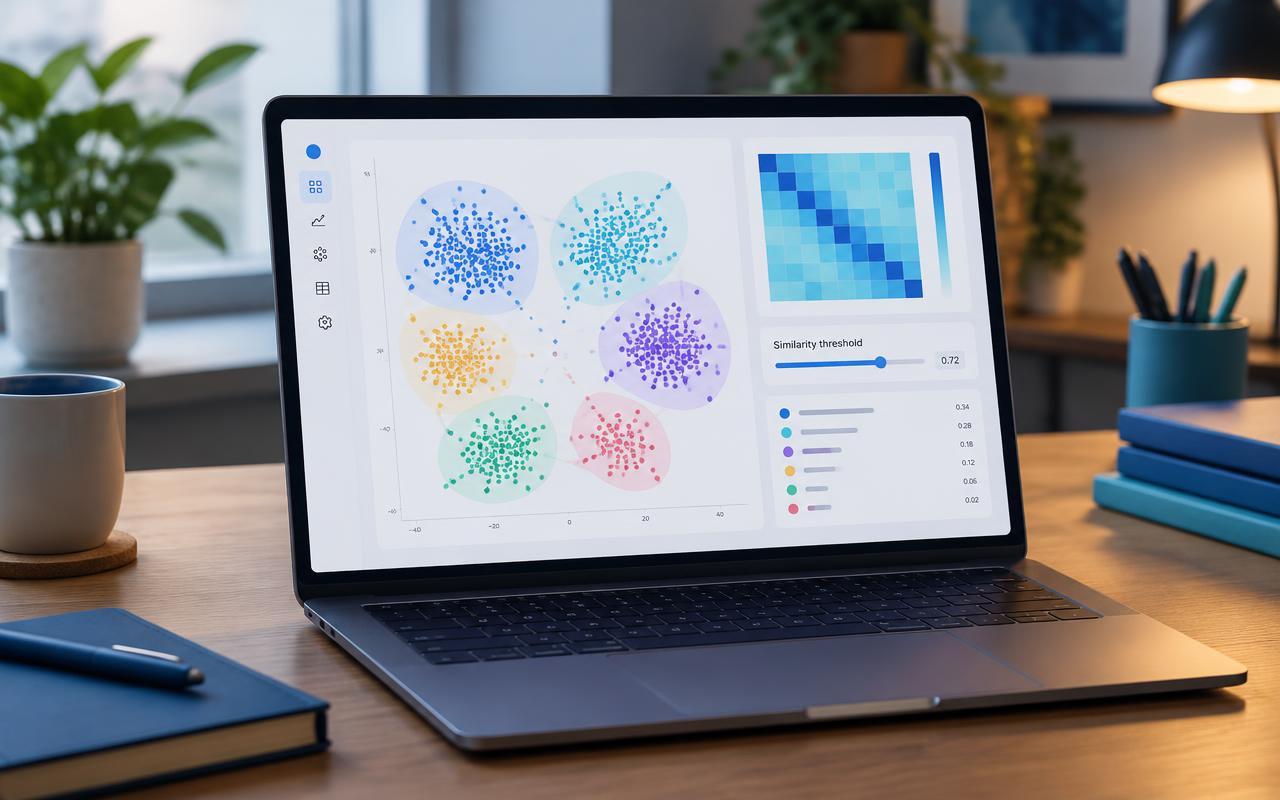
Context
Mars Information Services France supports several Mars group brands that publish pet-care advice: nutrition, health, life stages. Each brand grows its website with articles answering owners' questions, and the content team must decide which topics to write, update or merge.
However, these decisions rely on keyword analysis, which shows which terms appear, but not what articles mean. Two articles from sister brands may answer the same question and split the audience: this is cannibalisation. Conversely, some reader needs are covered by no article at all. Without an overview, editorial decisions are made case by case, after the fact. The meaning of the whole portfolio therefore needed to be represented to ground these decisions. The case was proposed at the Alsace Tech AI Autumn School (26–29 October 2026).
IMG-SCM-01 · CONTEXT
Semantic Content Mapping — context
Several brands publish hundreds of articles.
Problem
How can hundreds of articles be compared by meaning rather than by words, to identify those that compete across brands and the topics nobody covers?
Solution
Design and development of a semantic analysis pipeline that reads every article, represents its meaning as a vector and builds a map of the whole portfolio. The pipeline works in several steps:
- it groups articles into themes;
- it links them to business axes (species, food type, life stage, health);
- it compares them to detect cannibalisation and gaps.
The result is delivered as a self-contained, bilingual HTML dashboard that non-technical teams can use offline.
Results (aggregated):
- Corpus: 5 brands, 658 English articles (+4 Spanish, 662 classified in total) and 2,961 passages.
- Themes: 15 K-means themes grouped into 6 business families; UMAP map trustworthiness: 0.928.
- Cannibalisation: similarity threshold ≈ 0.82. A threshold of 0.816 maximised F1 (0.90) on 65 hand-labelled pairs. The result: 219 cross-brand pairs in 51 groups.
- Gaps: 4 portfolio-wide gaps, 8 thin-coverage cells and 12 brand-level gaps.
IMG-SCM-02 · SOLUTION
Semantic Content Mapping — solution
Cannibalisation and gaps, invisible to keywords.
Contribution
Team project of five, coached by Alexis Bigo Simon. I was responsible for steps 1 to 3 of the pipeline:
- Collection and cleaning:
- downloading pages and extracting the main text (trafilatura);
- removing text repeated across a brand's pages (menus, banners, calls to action). Without this cleaning, every article of a brand would have looked alike.
- Vectorisation:
BAAI/bge-m3embeddings (multilingual, 1,024 dimensions, up to 8,192 tokens), computed for whole articles and for passages of about 200 words. - Classification and mapping:
- K-means themes named by meaning (c-TF-IDF candidates, then embedding-based selection);
- tagging along business axes;
- UMAP map assessed by its trustworthiness.
Detection and the dashboard were built by the rest of the team.
Features
- A list of URLs (Excel, one sheet per brand) or a CSV is enough to build the cleaned corpus.
- Every article and passage receives a vector representation of its meaning.
- Articles are grouped into named themes, themselves gathered into business families.
- Each article is tagged by species, food type, life stage and health.
- Cross-brand pairs above the similarity threshold are listed and grouped (complete linkage), with paragraph overlap as evidence.
- A grid crossing the business axes reveals uncovered topics, with a scope rule specific to each brand.
- The dashboard brings together the map, the cannibalisation matrix, the gap grid and a live threshold slider.
Architecture
Each brand page is first downloaded, then reduced to its useful text. The bge-m3 model then turns this text into a vector, for the whole article and for each of its passages. Article vectors are grouped into themes, tagged by business axes and projected onto a two-dimensional map. Detection compares articles from different brands and keeps pairs that are too close; passage vectors provide evidence of duplicated content. The business-axis grid reveals empty cells. Everything is assembled into a self-contained dashboard.
IMG-SCM-03 · ARCHITECTURE
Semantic Content Mapping — overall architecture
Pages downloaded, repeated text removed.
Stack
Python, pandas, NumPy, scikit-learn (K-means, silhouette), SciPy (complete linkage, convex hulls), sentence-transformers / PyTorch (BAAI/bge-m3), umap-learn, trafilatura, BeautifulSoup, Plotly.js, JS/SVG dashboard, Google Colab.
Benefits
- Articles are compared by meaning, which keyword analysis cannot do.
- The team gets concrete lists of articles to merge and topics to write.
- A portfolio-wide overview allows anticipation instead of after-the-fact decisions.
- The offline dashboard is usable without technical skills.
- Acknowledged limits:
- Results are leads to review, not verdicts: high similarity does not prove identical search intent.
- An empty area on the map is not a gap; gaps come from the grid.
Links
github.com/JOHANNABELL/semantic-content-mapping · Mars data is not published.
This case study distinguishes the overall project scope from my personal contribution. No undocumented result or metric is presented.